
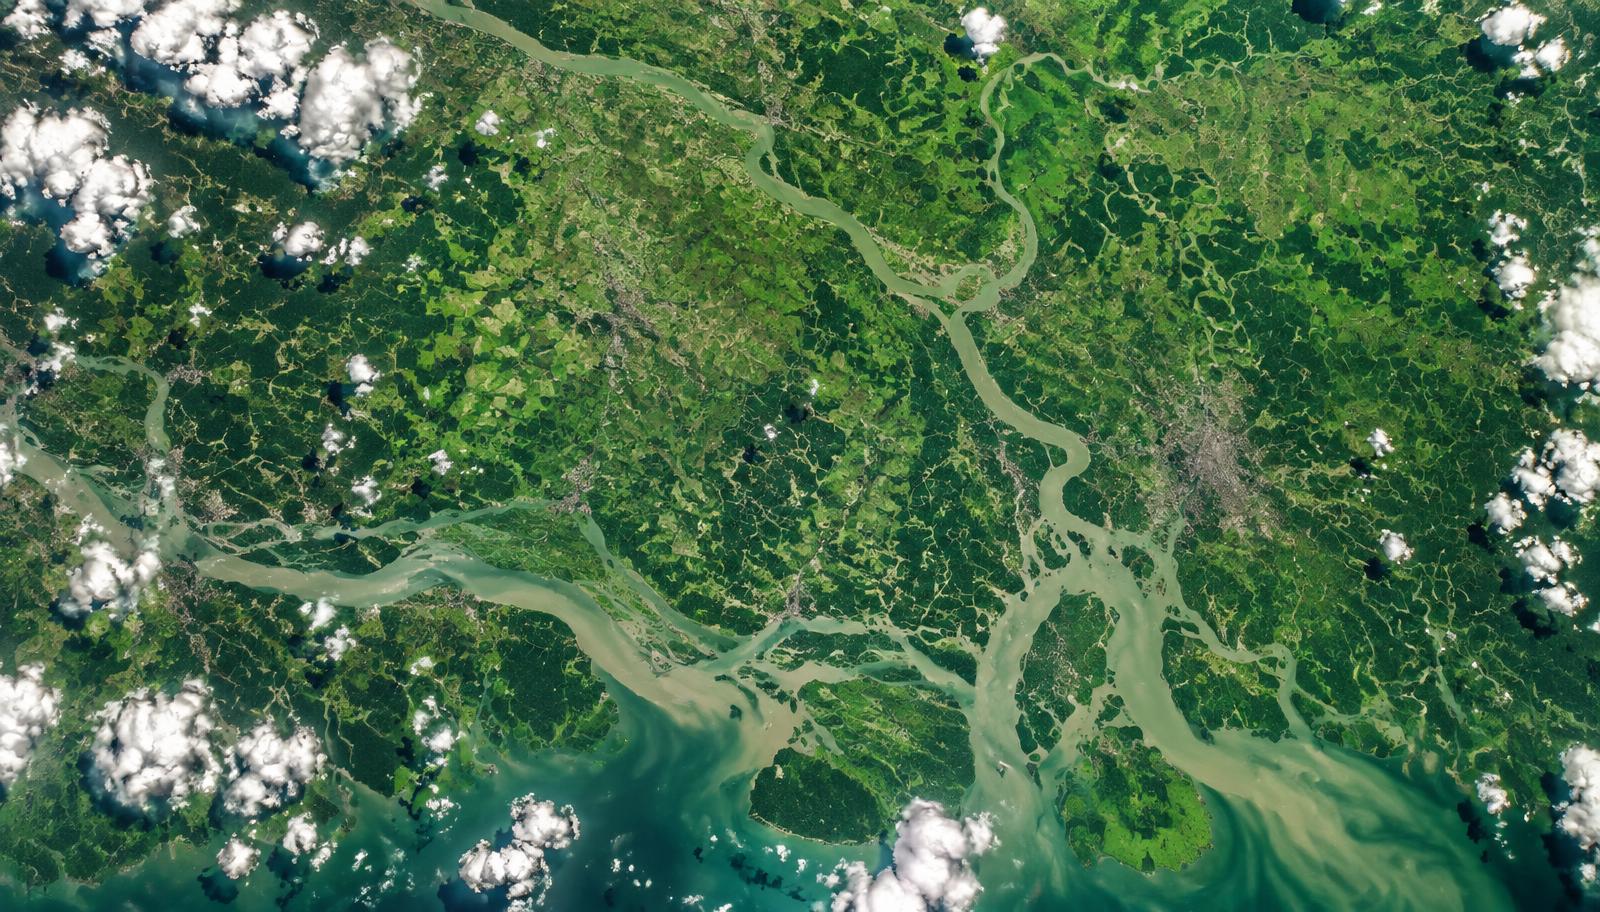


Vegetation — NDVI
Satellite cameras measure how strongly plants reflect light. The score, called NDVI, runs from about 0 (bare soil) to 1 (dense green canopy). Rising NDVI usually means more or healthier vegetation.
Plain-language guide
Every number on Terra Earth comes from NASA satellites and is checked with fixed statistical tests before it reaches a chart. This guide explains each idea in everyday words — no equations required.
Two NASA instruments feed every location page: MODIS Terra for vegetation and land-surface temperature, and NASA POWER for air temperature, rainfall and sunlight.
Satellite cameras measure how strongly plants reflect light. The score, called NDVI, runs from about 0 (bare soil) to 1 (dense green canopy). Rising NDVI usually means more or healthier vegetation.
Infrared sensors measure how hot the ground itself is — pavements, fields, rooftops. On sunny afternoons the surface is often much hotter than the air, which is why this number can sit well above the air temperature on the same page.
NASA POWER reports the air temperature about two metres above the ground, averaged over the month — the everyday temperature you would feel standing outside.
The same NASA POWER record carries corrected monthly rainfall and the sunlight energy reaching the surface. All three come from the same satellite-era archive, 2001 onward.
Before any analysis, Terra Earth saves a copy of the NASA observations for each location. Every page and every visitor reads the same saved numbers, so results cannot quietly change between visits.
The Mann–Kendall test compares every year with every later year and asks whether rising pairs clearly outnumber falling pairs. It answers “does this series keep moving one way?” — not “how fast?”.
Theil–Sen draws a line between every pair of years and keeps the middle slope. One strange heatwave year barely moves the median, so the rate of change — shown per decade — stays trustworthy.
The p-value is the chance of seeing a pattern this strong if the series were actually flat. When it drops below 0.05 — a 1-in-20 coincidence — we call the trend significant and show the badge.
Every chart keeps its provenance beside it: the dataset ID, the source link, and when the record was retrieved. You can always trace a number back to NASA itself.
When a location has no cached record, the page says “Data not yet available” instead of guessing. An honest blank teaches more than an invented number.
Put together: Mann–Kendall says whether a real direction exists, Theil–Sen says how fast it moves, and the p-value says how confident we may be. A trend gets shown as significant only when all three agree.
Statistics come only from tested code — Mann–Kendall and Theil–Sen. The AI assistant explains computed results; it never supplies climate values.
Comic art, mascots and location scenery exist to explain and welcome. Only the charts and provenance panels carry measured claims.
Comparisons use named representative capital points, each with its own record. They show how places differ — never a national average.
Weather jumps around every year. That is exactly why we test many years together before calling anything a trend.
Ready to investigate yourself? Open any location from the globe, or see the full dataset list on Data & Methods. Data & Methods